The Observatory
How can we think about millions of data points sitting in a database? What sorts of tools can we develop to help aid data-centric decision making? These were the primary questions that served as the impetus for creating The Observatory of Economic Complexity.
Big data, open data, data accessibility - these are all popular catch phases that have come to prominence in the last decade surrounding the question of harnessing the power of otherwise overwhelming amounts of data. More and more organizations and governments have begun the push towards opening the flood gates of collected data currently in their procession. Yet to actually make use of this torrent of information we need to build tools that enable and empower us. The Observatory is one such attempt.
Trade Flows
The dataset used in this website is the trade flow of products for every country dating back to 1962. By visualizing trade flows one is able to answer of number of questions at a glance that would otherwise be obscured by the sheer quantity of data. For example:
- What products did Turkey export in 2010?
- Which countries imported car in 2010?
- How has the export flow of Brazil to Argentina evolved over the past 15 years?
Visualize
What better way to comprehend a complex problem than to break it down into smaller, easier to digest pieces? The Observatory is a visualization engine that takes this exact approach — by slicing, manipulating and visualizing subsets of a larger dataset we can begin to recognize patterns and understand underlying trends.
Wikipedia
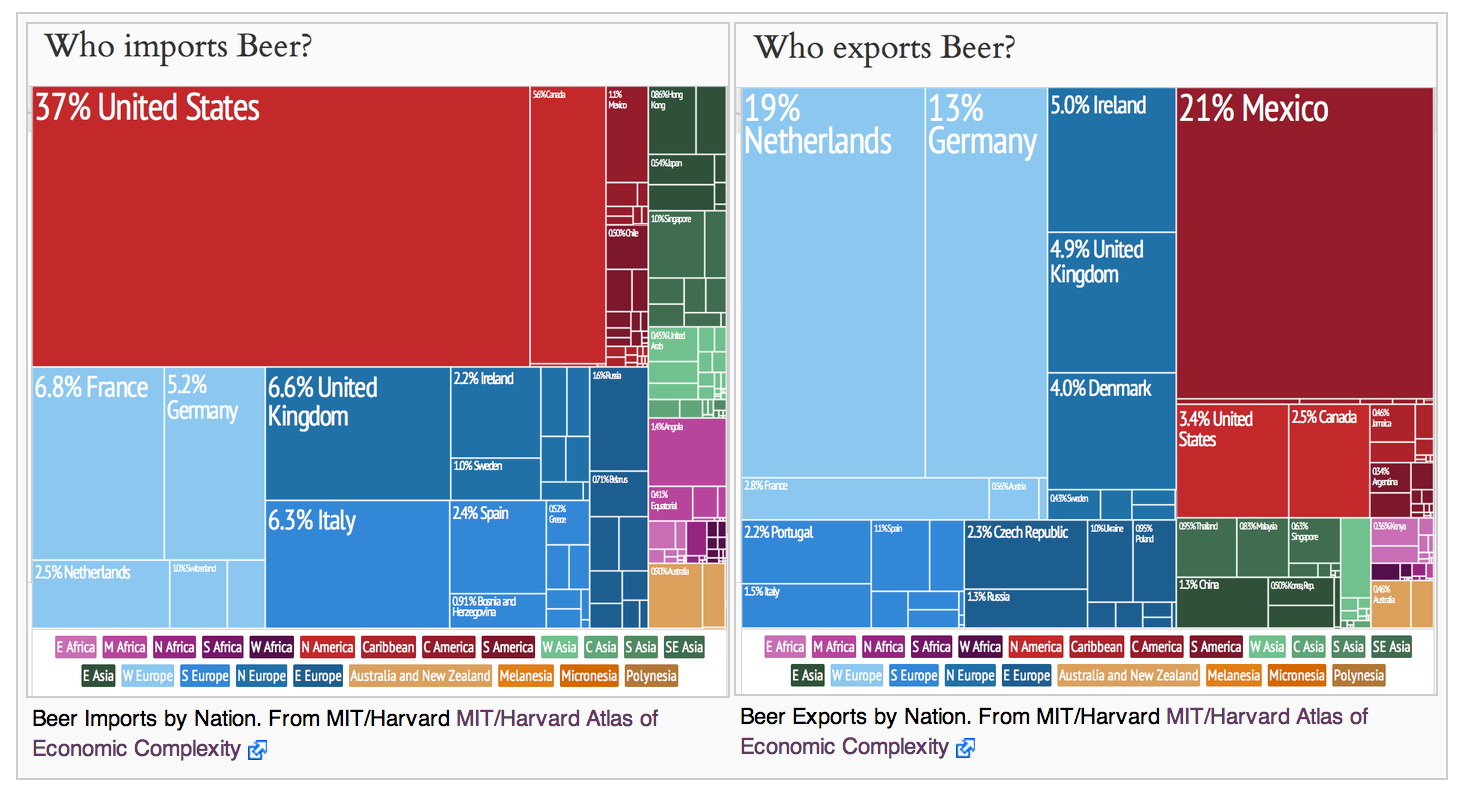
The visualizations have also caught some attention by the wikipedia community appearing on such disparate pages, ranging from "Uruguay's Economy" to "The Production and Trade of Beer".