Human Development Index (HDI) Tree


HDI Tree 1

Options

Show Labels

Show Perfect Tree

Show Data

HDI  
Indexes  
Income  
Health  
Education  
Values  
GNI per capita [PPP USD]  
Life Expectancy [Years]  
Mean Years of Schooling  
Expected Years of Schooling  

HDI Tree 2

Options

Show Labels

Show Perfect Tree

Show Data

HDI  
Indexes  
Income  
Health  
Education  
Values  
GNI per capita [PPP USD]  
Life Expectancy [Years]  
Mean Years of Schooling  
Expected Years of Schooling  


The HDI Tree

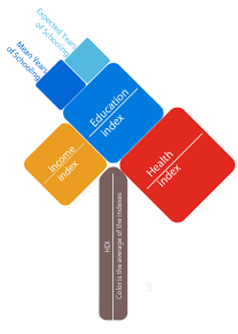
is a visual representation that can be used to illustrate the Human Development Index together with its components and subcomponents. The design rules of the HDI tree are:

  • The height of the tree trunk is proportional to the total value of the HDI
  • The size of the three branches are proportional to each sub-indicator
  • The branches are ordered in increasing order from left to right
  • The color of the trunk is the average of the color of the components

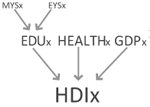
Mathematical Representation

HDI Tree Help

Diagramatic Representation

HDI Tree Help

HDI Tree Help

Source Data

Visualizations were created using data on the Human Development Index and its components provided by the HDR office at the UNDP. The use of the dataset allows comparing countries for an extended period of time: 1980-2010.

Visual Metaphor (The HDI Tree)

HDIx: Human Development Index
EDUx: Education Index
GDPx: Income Index
HEALTHx: Health Index
MYSx: Mean Years of Schooling Index
EYSx: Expected Years of Schooling Index

Development Team

App Design: A. Simoes
Concept: C.A. Hidalgo
Graphic Design: G. House, D. Landry, I. Meirelles, A. Simoes
Background Paper: Graphical Statistical Methods for the Representation of the Human Development Index and Its Components. CA Hidalgo. Human Development Research Paper 2010/39 (2010)